My 2026 diet began from a familiar starting point. At 87.8 kg (193.6 lb) and a BMI of 28.67, I was almost exactly where I had started my 2020 diet. This time, however, I approached weight loss differently. Rather than trying to lose weight as quickly as I reasonably could, I aimed for a steady rate of approximately 500 g (1.1 lb) per week.
The idea was to find a pace that I could sustain for as long as necessary to reach a healthy and reasonable weight while continuing my regular work and daily responsibilities. My previous longest diet had lasted about 17 weeks, and by that stage I had experienced considerable diet fatigue and interference with the rest of my life. In 2026, sustainability became part of the goal itself.
I think of this approach similarly to pacing in long-distance running. A runner may be capable of running much faster for a short distance, but that does not make it the right pace for a much longer run. The useful pace is one that can be maintained long enough to reach the finish line. I applied the same principle to weight loss: rather than maximizing the amount I could lose each week, I wanted to find a rate that I could maintain until reaching my target.
This approach also contrasts particularly well with my 2020 diet. The two diets began at almost identical weights, but my 2020 weight loss progressed considerably faster and ended at a BMI of 24.69. In 2026, I am deliberately moving more slowly, with the goal of continuing beyond the duration of my previous diets and eventually reaching a BMI of approximately 24 or slightly below.
The diet is still ongoing, so the results presented on this page are current rather than final. So far, however, the approximately 500 g-per-week approach has allowed me to continue beyond the duration of my previous diets while maintaining my regular responsibilities. The sections below document the calorie intake, daily activity, measured and predicted weight progression, and complete daily data behind this ongoing experiment.
Diet Summary
My 2026 diet is still in progress. Through August 10, after 19 weeks of dieting, my measured weight had decreased by 8.9 kg (19.6 lb), from 87.8 kg (193.6 lb) to 78.9 kg (173.9 lb). This corresponds to an average weight loss of approximately 0.47 kg (1.03 lb) per week, very close to my target of approximately 0.5 kg (1.1 lb) per week.
| Beginning | Current | |
| Date | March 30, 2026 | August 10, 2026 |
| Weight (kg) | 87.8 kg | 78.9 kg |
| Weight (lb) | 193.6 lb | 173.9 lb |
| BMI | 28.67 | 25.76 |
Progress So Far
| Duration | 19 weeks |
| Weight Loss | 8.9 kg (19.6 lb) |
| Average Weekly Weight Loss | 0.47 kg/week (1.03 lb/week) |
| Target Weekly Weight Loss | ~0.50 kg/week (1.10 lb/week) |
| Status | Ongoing |
Calorie Intake
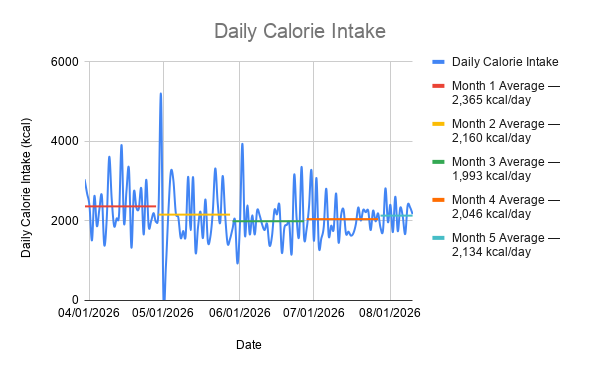
Throughout my 2026 diet, I have recorded my calorie intake every day. Through August 10, across the first 134 days of the diet, my average daily intake was approximately 2,140 calories.
The monthly averages so far have been: Month 1 — 2,365 kcal/day; Month 2 — 2,160 kcal/day; Month 3 — 1,993 kcal/day; Month 4 — 2,046 kcal/day; and Month 5 — 2,134 kcal/day.
The graph below shows my recorded daily calorie intake together with the average for each period. My average intake decreased considerably from Month 1 through Month 3 before increasing moderately during Months 4 and 5.
Daily Activity
Walking has been my main source of daily activity during my 2026 diet, and I have recorded my total number of steps each day. Daily activity is particularly important to my weight-loss approach because my prediction method incorporates activity alongside calorie intake.
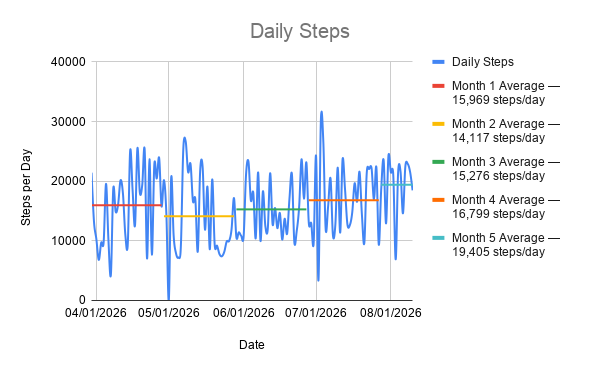
The beginning of this diet was different from my usual activity level. When I started, I was walking approximately 70,000 steps per week, considerably below the 100,000+ weekly steps that I normally aim for. During the first three weeks, I was therefore working in two directions at the same time: adapting to the diet itself while gradually rebuilding my activity level.
By the end of those first three weeks, I had brought my weekly steps back above 100,000 and was able to maintain a substantially higher activity level afterward. This early transition is visible in the graph below and is an important part of understanding the beginning of my 2026 diet.
Weight Progression
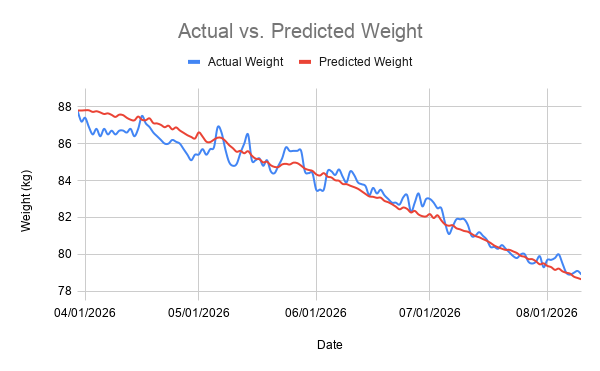
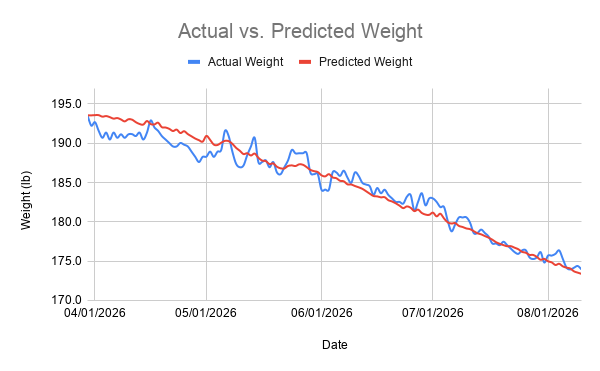
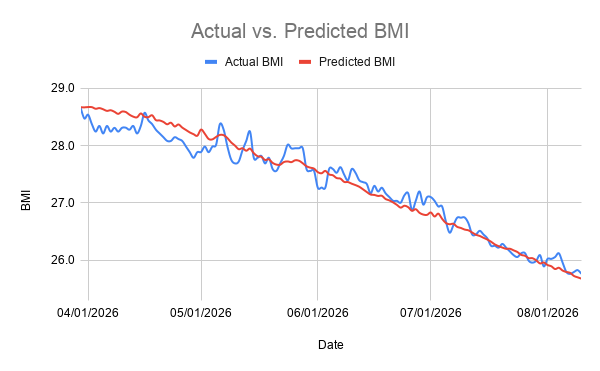
Alongside my measured weight, I have calculated a predicted weight for each day using my calorie intake, daily activity, and weight prediction method. The following graphs compare the measured and predicted trajectories throughout my 2026 diet so far.
As in my previous diets, my measured weight naturally fluctuates from day to day, while the predicted weight follows the cumulative calorie and activity calculations. The comparison provides a visual picture of how closely the prediction has followed my overall weight-loss trajectory as the diet has progressed.
Weight in Kilograms
The graph below compares my measured and predicted weight in kilograms throughout my 2026 diet so far.
Weight in Pounds
The same comparison is shown below in pounds for readers who use imperial units.
BMI
The final graph shows my measured and predicted BMI over the same period. Because BMI is calculated directly from weight and my height remains constant, this graph represents the same progression expressed in terms of BMI.
Results
My 2026 diet is still ongoing, so these results represent my progress through August 10 rather than the final outcome. After 19 weeks, my measured weight had decreased from 87.8 kg (193.6 lb) to 78.9 kg (173.9 lb), a total loss of 8.9 kg (19.6 lb). This corresponds to an average loss of approximately 0.47 kg (1.03 lb) per week, very close to my target of approximately 500 g per week.
More important to me than maximizing the speed of weight loss has been whether I can maintain this pace over a longer period while continuing my regular work and daily responsibilities. My previous longest diet lasted about 17 weeks and eventually became difficult to sustain. By Week 19 of my 2026 diet, I had already continued beyond that duration without the same level of interference with the rest of my life.
The progression has not been perfectly uniform. During the first three weeks, I was simultaneously adapting to the diet and rebuilding my activity from approximately 70,000 weekly steps to more than 100,000. Around Week 8, illness temporarily disrupted my routine and resulted in considerably less weight loss that week. The disruption remained limited to approximately one week, after which I was able to return to my regular approach.
These variations are also part of what I wanted to test with the slower approach. My goal is not to lose exactly 500 g every individual week, but to maintain an average pace around that level over a much longer period. Much like pacing a long-distance run, individual sections can be faster or slower while the overall pace remains sustainable enough to reach the destination.
The comparison with my 2020 diet is particularly interesting because the two diets began at almost identical weights. In 2020, I started at 87.5 kg and lost weight considerably faster, eventually reaching 75.6 kg and a BMI of 24.69 before ending the diet. In 2026, I started at 87.8 kg but deliberately chose a slower approach, with the goal of continuing beyond the duration of my previous diets and eventually reaching a BMI of approximately 24 or slightly below.
The 2026 diet therefore remains an ongoing test of a different strategy: prioritizing sustainability over speed. The results so far suggest that approximately 500 g of weight loss per week has been a manageable long-term pace for me, but the final evaluation will depend on whether I can continue this approach until reaching my target.
The 2026 dataset is also being used to evaluate my weight prediction method. Because the diet is still ongoing, its prediction results are not yet final. I include the current comparison on my My Weight Prediction Results page and will update it when the diet is complete.
Complete Daily Data
The table below contains the complete daily dataset from my 2026 diet through August 10. It includes my measured weight, BMI, calorie intake, daily steps, predicted daily weight change, and the corresponding predicted weight and BMI.
The graphs and results presented above were generated from this dataset. Because my 2026 diet is still ongoing, I will continue updating the table as new data become available.
Expand the table below to view the complete daily record.
View Complete Daily Data
| Day | Date | Actual Weight (kg) | Actual Weight (lb) | Actual BMI | Daily Calorie Intake (kcal) | Daily Steps | Predicted Daily Weight Change (g) | Predicted Weight (kg) | Predicted Weight (lb) | Predicted BMI |
| Monday | 08/10/2026 | 78.9 | 173.9 | 25.8 | 2170 | 23015 | 103 | 78.6 | 173.4 | 25.7 |
| Sunday | 08/09/2026 | 79.1 | 174.4 | 25.8 | 2340 | 21490 | 70 | 78.7 | 173.5 | 25.7 |
| Saturday | 08/08/2026 | 79 | 174.2 | 25.8 | 2390 | 22902 | 74 | 78.8 | 173.7 | 25.7 |
| Friday | 08/07/2026 | 78.9 | 173.9 | 25.8 | 1670 | 22464 | 164 | 79.0 | 174.1 | 25.8 |
| Thursday | 08/06/2026 | 79 | 174.2 | 25.8 | 2120 | 14603 | 49 | 79.0 | 174.2 | 25.8 |
| Wednesday | 08/05/2026 | 79.5 | 175.3 | 26.0 | 2330 | 21634 | 74 | 79.1 | 174.3 | 25.8 |
| Tuesday | 08/04/2026 | 80 | 176.4 | 26.1 | 1742 | 21388 | 150 | 79.2 | 174.7 | 25.9 |
| Monday | 08/03/2026 | 79.8 | 175.9 | 26.1 | 2610 | 6890 | -68 | 79.2 | 174.5 | 25.8 |
| Sunday | 08/02/2026 | 79.7 | 175.7 | 26.0 | 1720 | 21000 | 149 | 79.3 | 174.8 | 25.9 |
| Saturday | 08/01/2026 | 79.7 | 175.7 | 26.0 | 2405 | 21490 | 64 | 79.4 | 175.0 | 25.9 |
| Friday | 07/31/2026 | 79.3 | 174.8 | 25.9 | 1970 | 24245 | 139 | 79.5 | 175.3 | 26.0 |
| Thursday | 07/30/2026 | 79.9 | 176.1 | 26.1 | 2820 | 12916 | -52 | 79.5 | 175.2 | 25.9 |
| Wednesday | 07/29/2026 | 79.6 | 175.5 | 26.0 | 1760 | 23554 | 162 | 79.6 | 175.5 | 26.0 |
| Tuesday | 07/28/2026 | 79.5 | 175.3 | 26.0 | 1830 | 18633 | 117 | 79.7 | 175.8 | 26.0 |
| Monday | 07/27/2026 | 79.6 | 175.5 | 26.0 | 2190 | 9351 | 4 | 79.7 | 175.8 | 26.0 |
| Sunday | 07/26/2026 | 80.01 | 176.4 | 26.1 | 1990 | 22334 | 125 | 79.9 | 176.1 | 26.1 |
| Saturday | 07/25/2026 | 80 | 176.4 | 26.1 | 2260 | 16925 | 50 | 79.9 | 176.2 | 26.1 |
| Friday | 07/24/2026 | 79.8 | 175.9 | 26.1 | 1770 | 22164 | 151 | 80.1 | 176.5 | 26.1 |
| Thursday | 07/23/2026 | 79.9 | 176.1 | 26.1 | 2260 | 22042 | 87 | 80.2 | 176.7 | 26.2 |
| Wednesday | 07/22/2026 | 80.1 | 176.6 | 26.2 | 2220 | 21316 | 88 | 80.2 | 176.9 | 26.2 |
| Tuesday | 07/21/2026 | 80.3 | 177.0 | 26.2 | 2280 | 9619 | -5 | 80.2 | 176.9 | 26.2 |
| Monday | 07/20/2026 | 80.5 | 177.5 | 26.3 | 2010 | 14437 | 66 | 80.3 | 177.0 | 26.2 |
| Sunday | 07/19/2026 | 80.3 | 177.0 | 26.2 | 2340 | 21588 | 75 | 80.4 | 177.2 | 26.2 |
| Saturday | 07/18/2026 | 80.4 | 177.3 | 26.3 | 1920 | 16550 | 93 | 80.5 | 177.4 | 26.3 |
| Friday | 07/17/2026 | 80.4 | 177.3 | 26.3 | 1692 | 19657 | 145 | 80.6 | 177.7 | 26.3 |
| Thursday | 07/16/2026 | 80.8 | 178.1 | 26.4 | 1630 | 14763 | 119 | 80.7 | 178.0 | 26.4 |
| Wednesday | 07/15/2026 | 81 | 178.6 | 26.4 | 1730 | 12618 | 90 | 80.8 | 178.2 | 26.4 |
| Tuesday | 07/14/2026 | 81.2 | 179.0 | 26.5 | 1680 | 12773 | 98 | 80.9 | 178.4 | 26.4 |
| Monday | 07/13/2026 | 81.01 | 178.6 | 26.5 | 2286 | 18713 | 63 | 81.0 | 178.5 | 26.4 |
| Sunday | 07/12/2026 | 81 | 178.6 | 26.4 | 2136 | 23674 | 119 | 81.1 | 178.8 | 26.5 |
| Saturday | 07/11/2026 | 81.6 | 179.9 | 26.6 | 1456 | 11376 | 118 | 81.2 | 179.1 | 26.5 |
| Friday | 07/10/2026 | 81.91 | 180.6 | 26.7 | 2690 | 22264 | 40 | 81.3 | 179.2 | 26.5 |
| Thursday | 07/09/2026 | 81.9 | 180.6 | 26.7 | 1785 | 12680 | 86 | 81.4 | 179.3 | 26.6 |
| Wednesday | 07/08/2026 | 81.9 | 180.6 | 26.7 | 1880 | 10940 | 61 | 81.4 | 179.5 | 26.6 |
| Tuesday | 07/07/2026 | 81.5 | 179.7 | 26.6 | 1622 | 20477 | 164 | 81.6 | 179.8 | 26.6 |
| Monday | 07/06/2026 | 81.1 | 178.8 | 26.5 | 2810 | 15736 | -27 | 81.5 | 179.8 | 26.6 |
| Sunday | 07/05/2026 | 81.7 | 180.1 | 26.7 | 1860 | 11914 | 70 | 81.6 | 179.9 | 26.7 |
| Saturday | 07/04/2026 | 82.5 | 181.9 | 26.9 | 1560 | 26843 | 223 | 81.8 | 180.4 | 26.7 |
| Friday | 07/03/2026 | 82.5 | 181.9 | 26.9 | 1350 | 30074 | 274 | 82.1 | 181.0 | 26.8 |
| Thursday | 07/02/2026 | 82.8 | 182.5 | 27.0 | 3080 | 3355 | -150 | 82.0 | 180.7 | 26.8 |
| Wednesday | 07/01/2026 | 83 | 183.0 | 27.1 | 1500 | 24276 | 213 | 82.2 | 181.2 | 26.8 |
| Tuesday | 06/30/2026 | 83 | 183.0 | 27.1 | 3270 | 9526 | -128 | 82.1 | 180.9 | 26.8 |
| Monday | 06/29/2026 | 82.6 | 182.1 | 27.0 | 2350 | 12964 | 16 | 82.1 | 180.9 | 26.8 |
| Sunday | 06/28/2026 | 83.3 | 183.6 | 27.2 | 1780 | 13020 | 93 | 82.2 | 181.1 | 26.8 |
| Saturday | 06/27/2026 | 82.8 | 182.5 | 27.0 | 1580 | 23134 | 193 | 82.4 | 181.6 | 26.9 |
| Friday | 06/26/2026 | 82.3 | 181.4 | 26.9 | 3360 | 17072 | -85 | 82.3 | 181.4 | 26.9 |
| Thursday | 06/25/2026 | 83.2 | 183.4 | 27.2 | 1630 | 23674 | 192 | 82.5 | 181.8 | 26.9 |
| Wednesday | 06/24/2026 | 83.1 | 183.2 | 27.1 | 2050 | 15693 | 77 | 82.5 | 182.0 | 27.0 |
| Tuesday | 06/23/2026 | 82.7 | 182.3 | 27.0 | 3160 | 11652 | -98 | 82.4 | 181.7 | 26.9 |
| Monday | 06/22/2026 | 82.8 | 182.5 | 27.0 | 1180 | 9833 | 145 | 82.6 | 182.1 | 27.0 |
| Sunday | 06/21/2026 | 82.8 | 182.5 | 27.0 | 1940 | 21210 | 132 | 82.7 | 182.4 | 27.0 |
| Saturday | 06/20/2026 | 83 | 183.0 | 27.1 | 1900 | 17119 | 107 | 82.8 | 182.6 | 27.0 |
| Friday | 06/19/2026 | 83.2 | 183.4 | 27.2 | 1820 | 11169 | 73 | 82.9 | 182.8 | 27.1 |
| Thursday | 06/18/2026 | 83.5 | 184.1 | 27.3 | 1200 | 13705 | 173 | 83.1 | 183.1 | 27.1 |
| Wednesday | 06/17/2026 | 83.3 | 183.6 | 27.2 | 2400 | 10209 | -9 | 83.1 | 183.1 | 27.1 |
| Tuesday | 06/16/2026 | 83.6 | 184.3 | 27.3 | 2165 | 14668 | 56 | 83.1 | 183.2 | 27.1 |
| Monday | 06/15/2026 | 83.2 | 183.4 | 27.2 | 2276 | 12115 | 21 | 83.1 | 183.3 | 27.1 |
| Sunday | 06/14/2026 | 83.7 | 184.5 | 27.3 | 1620 | 15498 | 133 | 83.3 | 183.6 | 27.2 |
| Saturday | 06/13/2026 | 83.8 | 184.7 | 27.4 | 1380 | 12768 | 144 | 83.4 | 183.9 | 27.2 |
| Friday | 06/12/2026 | 83.9 | 185.0 | 27.4 | 1930 | 21338 | 138 | 83.6 | 184.2 | 27.3 |
| Thursday | 06/11/2026 | 84.3 | 185.8 | 27.5 | 1770 | 11965 | 88 | 83.6 | 184.4 | 27.3 |
| Wednesday | 06/10/2026 | 84.5 | 186.3 | 27.6 | 1910 | 12464 | 74 | 83.7 | 184.6 | 27.3 |
| Tuesday | 06/09/2026 | 83.9 | 185.0 | 27.4 | 2140 | 18308 | 88 | 83.8 | 184.8 | 27.4 |
| Monday | 06/08/2026 | 84.2 | 185.6 | 27.5 | 2270 | 9968 | 8 | 83.8 | 184.8 | 27.4 |
| Sunday | 06/07/2026 | 84.6 | 186.5 | 27.6 | 1660 | 21477 | 176 | 84.0 | 185.2 | 27.4 |
| Saturday | 06/06/2026 | 84.3 | 185.8 | 27.5 | 2140 | 10411 | 28 | 84.0 | 185.2 | 27.4 |
| Friday | 06/05/2026 | 84.5 | 186.3 | 27.6 | 1660 | 18074 | 150 | 84.2 | 185.6 | 27.5 |
| Thursday | 06/04/2026 | 84.5 | 186.3 | 27.6 | 2390 | 16781 | 45 | 84.2 | 185.7 | 27.5 |
| Wednesday | 06/03/2026 | 83.51 | 184.1 | 27.3 | 1650 | 23300 | 188 | 84.4 | 186.1 | 27.6 |
| Tuesday | 06/02/2026 | 83.51 | 184.1 | 27.3 | 3940 | 21085 | -126 | 84.3 | 185.8 | 27.5 |
| Monday | 06/01/2026 | 83.5 | 184.1 | 27.3 | 1910 | 10727 | 59 | 84.3 | 185.9 | 27.5 |
| Sunday | 05/31/2026 | 84.4 | 186.1 | 27.6 | 930 | 10831 | 189 | 84.5 | 186.3 | 27.6 |
| Saturday | 05/30/2026 | 84.4 | 186.1 | 27.6 | 2020 | 11429 | 52 | 84.6 | 186.5 | 27.6 |
| Friday | 05/29/2026 | 84.5 | 186.3 | 27.6 | 1802 | 10594 | 74 | 84.6 | 186.6 | 27.6 |
| Thursday | 05/28/2026 | 85.61 | 188.7 | 28.0 | 1550 | 17165 | 160 | 84.8 | 187.0 | 27.7 |
| Wednesday | 05/27/2026 | 85.61 | 188.7 | 28.0 | 1430 | 11921 | 135 | 84.9 | 187.3 | 27.7 |
| Tuesday | 05/26/2026 | 85.61 | 188.7 | 28.0 | 2150 | 9984 | 27 | 85.0 | 187.3 | 27.7 |
| Monday | 05/25/2026 | 85.6 | 188.7 | 28.0 | 3130 | 9899 | -101 | 84.9 | 187.1 | 27.7 |
| Sunday | 05/24/2026 | 85.8 | 189.2 | 28.0 | 1960 | 8177 | 38 | 84.9 | 187.2 | 27.7 |
| Saturday | 05/23/2026 | 85.2 | 187.8 | 27.8 | 2440 | 7408 | -32 | 84.9 | 187.1 | 27.7 |
| Friday | 05/22/2026 | 84.8 | 187.0 | 27.7 | 3320 | 7766 | -144 | 84.7 | 186.8 | 27.7 |
| Thursday | 05/21/2026 | 84.4 | 186.1 | 27.6 | 2240 | 9172 | 6 | 84.7 | 186.8 | 27.7 |
| Wednesday | 05/20/2026 | 84.5 | 186.3 | 27.6 | 1600 | 9421 | 91 | 84.8 | 187.0 | 27.7 |
| Tuesday | 05/19/2026 | 85.1 | 187.6 | 27.8 | 1480 | 20299 | 192 | 85.0 | 187.4 | 27.8 |
| Monday | 05/18/2026 | 84.8 | 187.0 | 27.7 | 2540 | 8577 | -37 | 85.0 | 187.4 | 27.7 |
| Sunday | 05/17/2026 | 85.2 | 187.8 | 27.8 | 1570 | 19089 | 171 | 85.2 | 187.7 | 27.8 |
| Saturday | 05/16/2026 | 85.1 | 187.6 | 27.8 | 2230 | 11873 | 30 | 85.2 | 187.8 | 27.8 |
| Friday | 05/15/2026 | 85.1 | 187.6 | 27.8 | 1840 | 22477 | 162 | 85.3 | 188.2 | 27.9 |
| Thursday | 05/14/2026 | 86.5 | 190.7 | 28.2 | 1220 | 21746 | 242 | 85.6 | 188.7 | 27.9 |
| Wednesday | 05/13/2026 | 86 | 189.6 | 28.1 | 3100 | 8188 | -110 | 85.5 | 188.4 | 27.9 |
| Tuesday | 05/12/2026 | 85.5 | 188.5 | 27.9 | 1770 | 16929 | 130 | 85.6 | 188.7 | 28.0 |
| Monday | 05/11/2026 | 84.9 | 187.2 | 27.7 | 3110 | 16654 | -48 | 85.6 | 188.6 | 27.9 |
| Sunday | 05/10/2026 | 84.8 | 187.0 | 27.7 | 1630 | 22904 | 192 | 85.8 | 189.1 | 28.0 |
| Saturday | 05/09/2026 | 85 | 187.4 | 27.8 | 1746 | 21529 | 167 | 85.9 | 189.4 | 28.1 |
| Friday | 05/08/2026 | 85.7 | 188.9 | 28.0 | 1570 | 26666 | 232 | 86.2 | 189.9 | 28.1 |
| Thursday | 05/07/2026 | 86.6 | 190.9 | 28.3 | 2090 | 25291 | 157 | 86.3 | 190.3 | 28.2 |
| Wednesday | 05/06/2026 | 86.9 | 191.6 | 28.4 | 2200 | 9115 | 16 | 86.3 | 190.3 | 28.2 |
| Tuesday | 05/05/2026 | 85.8 | 189.2 | 28.0 | 3030 | 7201 | -109 | 86.2 | 190.1 | 28.2 |
| Monday | 05/04/2026 | 85.7 | 188.9 | 28.0 | 3240 | 7882 | -131 | 86.1 | 189.8 | 28.1 |
| Sunday | 05/03/2026 | 85.4 | 188.3 | 27.9 | 2240 | 10952 | 22 | 86.1 | 189.8 | 28.1 |
| Saturday | 05/02/2026 | 85.7 | 188.9 | 28.0 | 880 | 20634 | 274 | 86.4 | 190.4 | 28.2 |
| Friday | 05/01/2026 | 85.41 | 188.3 | 27.9 | 0 | 0 | 228 | 86.6 | 190.9 | 28.3 |
| Thursday | 04/30/2026 | 85.4 | 188.3 | 27.9 | 5170 | 14437 | -331 | 86.3 | 190.2 | 28.2 |
| Wednesday | 04/29/2026 | 85.1 | 187.6 | 27.8 | 2310 | 20167 | 83 | 86.4 | 190.4 | 28.2 |
| Tuesday | 04/28/2026 | 85.4 | 188.3 | 27.9 | 1976 | 15777 | 94 | 86.5 | 190.6 | 28.2 |
| Monday | 04/27/2026 | 85.7 | 188.9 | 28.0 | 2196 | 23920 | 129 | 86.6 | 190.9 | 28.3 |
| Sunday | 04/26/2026 | 86 | 189.6 | 28.1 | 1996 | 20457 | 129 | 86.7 | 191.2 | 28.3 |
| Saturday | 04/25/2026 | 86.1 | 189.8 | 28.1 | 1860 | 22770 | 165 | 86.9 | 191.5 | 28.4 |
| Friday | 04/24/2026 | 86.2 | 190.0 | 28.1 | 3035 | 7680 | -105 | 86.8 | 191.3 | 28.3 |
| Thursday | 04/23/2026 | 86 | 189.6 | 28.1 | 1660 | 23677 | 198 | 87.0 | 191.7 | 28.4 |
| Wednesday | 04/22/2026 | 86 | 189.6 | 28.1 | 2820 | 7027 | -82 | 86.9 | 191.6 | 28.4 |
| Tuesday | 04/21/2026 | 86.2 | 190.0 | 28.1 | 2310 | 25280 | 127 | 87.0 | 191.8 | 28.4 |
| Monday | 04/20/2026 | 86.4 | 190.5 | 28.2 | 2336 | 19367 | 78 | 87.1 | 192.0 | 28.4 |
| Sunday | 04/19/2026 | 86.6 | 190.9 | 28.3 | 2730 | 18098 | 17 | 87.1 | 192.0 | 28.4 |
| Saturday | 04/18/2026 | 86.9 | 191.6 | 28.4 | 1330 | 25525 | 259 | 87.4 | 192.6 | 28.5 |
| Friday | 04/17/2026 | 87.1 | 192.0 | 28.4 | 3310 | 12565 | -100 | 87.3 | 192.4 | 28.5 |
| Thursday | 04/16/2026 | 87.5 | 192.9 | 28.6 | 2753 | 18522 | 20 | 87.3 | 192.4 | 28.5 |
| Wednesday | 04/15/2026 | 86.8 | 191.4 | 28.3 | 1940 | 25124 | 176 | 87.5 | 192.8 | 28.6 |
| Tuesday | 04/14/2026 | 86.4 | 190.5 | 28.2 | 3910 | 9426 | -204 | 87.3 | 192.4 | 28.5 |
| Monday | 04/13/2026 | 86.8 | 191.4 | 28.3 | 2170 | 10989 | 35 | 87.3 | 192.5 | 28.5 |
| Sunday | 04/12/2026 | 86.6 | 190.9 | 28.3 | 2060 | 17953 | 103 | 87.4 | 192.7 | 28.5 |
| Saturday | 04/11/2026 | 86.71 | 191.2 | 28.3 | 1870 | 20134 | 145 | 87.5 | 193.0 | 28.6 |
| Friday | 04/10/2026 | 86.7 | 191.1 | 28.3 | 2560 | 16074 | 24 | 87.6 | 193.1 | 28.6 |
| Thursday | 04/09/2026 | 86.5 | 190.7 | 28.2 | 3610 | 14872 | -122 | 87.4 | 192.8 | 28.6 |
| Wednesday | 04/08/2026 | 86.7 | 191.1 | 28.3 | 2060 | 18761 | 110 | 87.6 | 193.0 | 28.6 |
| Tuesday | 04/07/2026 | 86.5 | 190.7 | 28.2 | 1390 | 4284 | 82 | 87.6 | 193.2 | 28.6 |
| Monday | 04/06/2026 | 86.8 | 191.4 | 28.3 | 2640 | 10062 | -34 | 87.6 | 193.1 | 28.6 |
| Sunday | 04/05/2026 | 86.4 | 190.5 | 28.2 | 2290 | 19547 | 85 | 87.7 | 193.3 | 28.6 |
| Saturday | 04/04/2026 | 86.8 | 191.4 | 28.3 | 1870 | 9733 | 64 | 87.8 | 193.5 | 28.7 |
| Friday | 04/03/2026 | 86.5 | 190.7 | 28.2 | 2630 | 9697 | -36 | 87.7 | 193.4 | 28.6 |
| Thursday | 04/02/2026 | 86.9 | 191.6 | 28.4 | 1510 | 6800 | 87 | 87.8 | 193.6 | 28.7 |
| Wednesday | 04/01/2026 | 87.4 | 192.7 | 28.5 | 2380 | 10260 | 3 | 87.8 | 193.6 | 28.7 |
| Tuesday | 03/31/2026 | 87.2 | 192.2 | 28.5 | 2700 | 13253 | -15 | 87.8 | 193.6 | 28.7 |
| Monday | 03/30/2026 | 87.8 | 193.6 | 28.7 | 3050 | 21438 | 6 | 87.8 | 193.6 | 28.7 |