My weight prediction method uses my recorded calorie intake and daily activity to estimate how my weight should change over time. While My Weight Prediction Method explains how the calculations work, this page focuses on how those predictions compare with my measured weight in practice.
I have applied the method to four diet periods with the required daily data: 2021, 2022, 2024, and 2026. By comparing predicted and measured weight throughout each diet, I can evaluate both the size and direction of the prediction errors and how those errors change over time.
The results below summarize these comparisons using final prediction error, mean prediction error, mean absolute error, and the progression of prediction error throughout each diet. The 2026 diet is still ongoing, so its results are current rather than final.
Overall Results
The table below summarizes the performance of my weight prediction method across the four diets. I use three measures: final prediction error, mean prediction error, and mean absolute error (MAE).
| Diet | Final Prediction Error | Mean Prediction Error | Mean Absolute Error (MAE) |
| 2021 | −0.6 kg (−1.3 lb) | −0.24 kg (−0.53 lb) | 0.40 kg (0.88 lb) |
| 2022 | +0.9 kg (+2.0 lb) | +0.64 kg (+1.41 lb) | 0.77 kg (1.70 lb) |
| 2024 | −2.8 kg (−6.2 lb) | −1.89 kg (−4.17 lb) | 1.99 kg (4.39 lb) |
| 2026* | −0.3 kg (−0.7 lb) | +0.07 kg (+0.15 lb) | 0.49 kg (1.08 lb) |
Final Prediction Error is the difference between predicted and measured weight at the end of the diet. Mean Prediction Error is the average signed difference throughout the diet and shows whether the prediction generally ran above or below measured weight. Mean Absolute Error (MAE) measures the average size of the daily prediction error regardless of direction.
For the signed errors, a negative value means the predicted weight was lower than the measured weight, while a positive value means the predicted weight was higher.
The 2026 diet is ongoing, so its values represent the results to date rather than final results.
Prediction Error Over Time
The graphs below show how the prediction error changed throughout each diet. Prediction error is calculated as predicted weight − measured weight, so a value of zero represents an exact match between the prediction and measurement. Positive values indicate that the predicted weight was higher than the measured weight, while negative values indicate that it was lower.
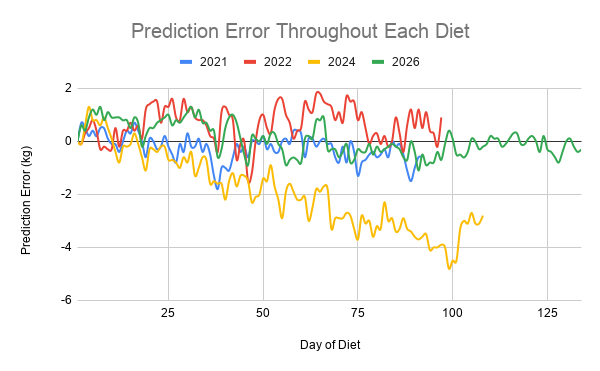
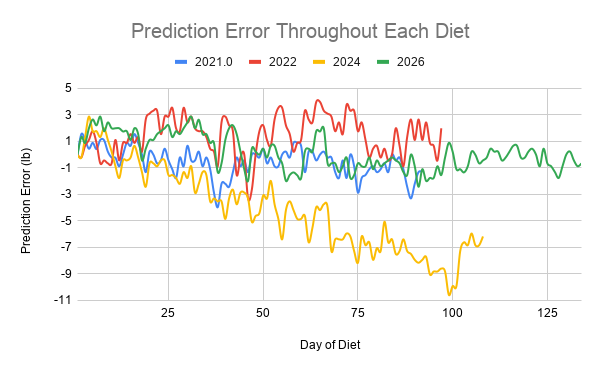
The prediction remained relatively close to measured weight throughout most of 2021 and 2022, although 2021 developed a more negative tendency later in the diet while 2022 showed an overall positive bias. In 2024, the prediction began relatively close to measured weight but progressively diverged in the negative direction. In the ongoing 2026 diet, the error has continued to fluctuate around zero.
The four datasets therefore do not show a single pattern in which prediction error simply increases as a diet becomes longer. In particular, 2026 is currently the longest of the four datasets while continuing to remain relatively close to zero.
What the Results Tell Me
Across the four diets, the prediction method produced relatively close results in 2021, 2022, and so far in 2026, while the 2024 dataset showed a substantially larger and more persistent difference between predicted and measured weight.
The results also show that the prediction error does not behave the same way in every diet. It can fluctuate above and below measured weight, develop a bias in one direction, or, as in 2024, progressively diverge. The available data does not establish why the 2024 prediction behaved differently, so I do not attribute that difference to any single factor.
Overall, I view the method as a useful estimate of expected weight progression rather than an exact prediction of what the scale will show. Measured weight remains the actual outcome, while the predicted weight provides a reference point that I can compare with it throughout a diet.
Current Use
I continue to use my weight prediction method as a reference during my ongoing 2026 diet. Rather than expecting the predicted and measured weights to match exactly each day, I compare their longer-term progression to see how closely my actual weight follows the expected trend.
The prediction therefore complements my measured weight rather than replacing it. As I continue collecting data, I can also use future diet periods to further evaluate how consistently the method performs over time.
The 2026 results on this page will be updated when my current diet is complete.